- Home
- Network
- Firewall e gateway
- Gateway / controller
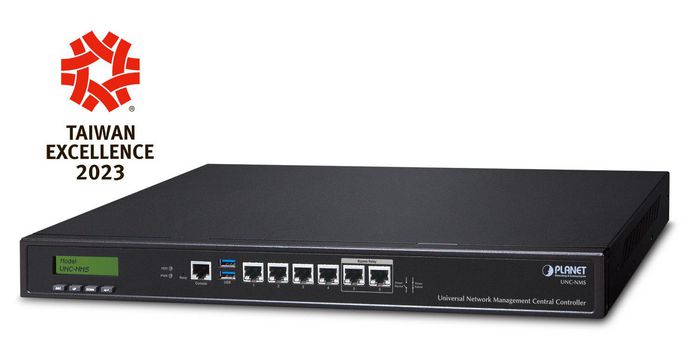
- Planet Universal Network Management Central Controller - 1024 x 100 nodes (19-inch rack-mount, System LCD, 6 10/100/1000T LAN Ports, 1 pair bypass, centrally manages up to 100 sites of NMS-500/NMS-1000V series, site map viewing and topology view, top 10-site events, history comparison graph and critical event chart for analyzing network status) – UNC-NMS
Planet Universal Network Management Central Controller - 1024 x 100 nodes (19-inch rack-mount, System LCD, 6 10/100/1000T LAN Ports, 1 pair bypass, centrally manages up to 100 sites of NMS-500/NMS-1000V series, site map viewing and topology view, top 10-site events, history comparison graph and critical event chart for analyzing network status)

Planet Universal Network Management Central Controller - 1024 x 100 nodes (19-inch rack-mount, System LCD, 6 10/100/1000T LAN Ports, 1 pair bypass, centrally manages up to 100 sites of NMS-500/NMS-1000V series, site map viewing and topology view, top 10-site events, history comparison graph and critical event chart for analyzing network status)
MPN UNC-NMS
Codice articolo W127040302
Livello stock
Universal Network Management Central Controller with LCD
PLANET's NMS-500 and NMS-1000V Network Management Central Controllers can directly monitor 512 and 1024 nodes, respectively, in each site. They both can monitor up to 100 sites. However, the deployed devices, such as managed switches, media converters, routers, smart APs, VoIP phones, IP cameras, etc., have to be compliant with the MQTT Protocol, SNMP Protocol, ONVIF Protocol and PLANET Smart Discovery utility. These enable the ad...
Industrial-grade Physical Hardware
6 x 10/100/1000BASE-T Gigabit Ethernet RJ45 ports (LAN 5 and LAN 6 are bypass ports)
1 x LCM for basic system setting
2 x LEDs (Power and HDD)
2 x USB 3.0 ports for configuration backup and restoration
1 x RJ45 Console port interface
1 x Factory default button (GPIO)
1 x 3-pin AC Power input socket for 100~240V
1U Rack-mount
Network Devices Management
Specifiche per UNC-NMS
Certificates
Certification
CE, FCC
Design
Certification
CE, FCC
Enclosure material
Metal
LED indicators
HDD/Power
Mounting type
Rack mounting
Product colour
Black
Rack capacity
1U
Indication
LED indicators
HDD/Power
Operational conditions
Operating relative humidity (H-H)
5 - 90 %
Operating temperature (T-T)
0 - 50 °C
Storage relative humidity (H-H)
5 - 90 %
Storage temperature (T-T)
-20 - 70 °C
Package dimensions
Gross Weight (Package, kg)
3,01 kg
Product dimensions
Net Weight (Product, kg)
3 kg
Product Depth
18 cm
Product Height
4,4 cm
Product Width
43,8 cm
Vendor information
Descrizione
Universal Network Management Central Controller with LCD
PLANET's NMS-500 and NMS-1000V Network Management Central Controllers can directly monitor 512 and 1024 nodes, respectively, in each site. They both can monitor up to 100 sites. However, the deployed devices, such as managed switches, media converters, routers, smart APs, VoIP phones, IP cameras, etc., have to be compliant with the MQTT Protocol, SNMP Protocol, ONVIF Protocol and PLANET Smart Discovery utility. These enable the administrator to centrally manage these nodes from a central office, greatly boosting network and power management efficiency.
PLANET NMS solution features intuitive dashboard, topology and map viewing to make network management efficient and effective.
The exclusive product features for PLANET NMS solution include:
- Centralized control of up to 102,400 nodes
- System upgrade and license (free of charge)
- Intuitive and user-friendly management functions
Interactive Dashboard Shows Network Statuses in an Instant
The NMS Controller’s interactive dashboard includes all the managed sites of network routers, switches, access points and PoE statistics. The administrator can quickly overview the status of each device from the Network Summary and Mapping window. Through each dashboard function button, the administrator can quickly link to the detailed current status. The site management page of deployed nodes can be monitored and managed in the VPN network environment. Status on a faulty event or log-in page is also displayed, thus immediately knowing where the disconnection issue comes from.
Watch Over Network within Minutes
The Device list information web page presents a list of managed devices, an NMS agent dashboard, topology view, AP control, and event and log viewing function. It provides the at-a-glance and efficient summary of your management network. It lets you have a valuable information on the current wired and wireless network statuses via data-driven graphical charts for each site. The topology viewer and event reports enable you to visualize the system usage and node status in real time so as to address whatever issue they may have.
Optimizing Multiple Sites with Topology Viewer (with Maps)
With the site maps, each site can be located according to the map, thus helping the administrator quickly overview the NMS agent and saving time and cost of on-site support and monitoring. The current statuses of NMS agents are shown in real time to optimize the site-to-site VPN network performance. The NMS Center Controller can provide up to 100 sites for all managed NMS agents.
Real-time Centralized Monitoring with E-mail Alarm Function
As the NMS controllers can display a topology view of the deployed powered devices, they can detect which device is online (Green) or offline (Red). The real-time centralized monitoring of these devices can help the administrator know what the current statuses of these devices are. Pop-up alerts shown on the touch panel tell where the problems are. The e-mail alarm function is designed to send an email alert to the administrator via the SMTP server where syslog information can be found once an abnormality is detected. This can prompt the administrator to quickly fix the identified problem in the network.
Statistics for Top 10 Events to Manage Network Traffic and PoE Power
The NMS statistic page lists the top 10 inbound and outbound traffic, PoE health, and critical events. It can help administrator to analyze which device is having abnormal power consumption, abnormally high temperature, illegal time of usage, and the near end of life cycle in order to avoid network crash.
Power Consumption Analysis and Unloading Management Mechanism
The NMS Controllers provide raw data records for PoE device power usage. Through the history statistics, the administrator can flexibly operate in whatever power is in demand. For energy savings and carbon reduction, the NMS system can help enterprises to save energy by unloading the low priority devices and ensure the safety and stability of electricity consumption in the overall environment of company, factory, etc.
Learn more: https://www.planet.com.tw/en/product/unc-nms
*Le informazioni del prodotto sopra riportate sono fornite da Icecat. EET non può essere ritenuta responsabile di errori in relazione a ciò..